Objectifs globaux : Understand how to compare inputs, and describe their relationship in a basic way.
Objectifs travaillés : Correlation types, vocabulary to describe tables and charts.
Resources :
PDF: Does chocolate make you intelligent?
PDF: Nobel Laureates compared to chocolate consumption
PDF: Positive and negative correlations
PDF: The need to seek causes
PDF: Correlation and causality evaluation
Contents
Activité 1
Do you think chocolate can make you intelligent?
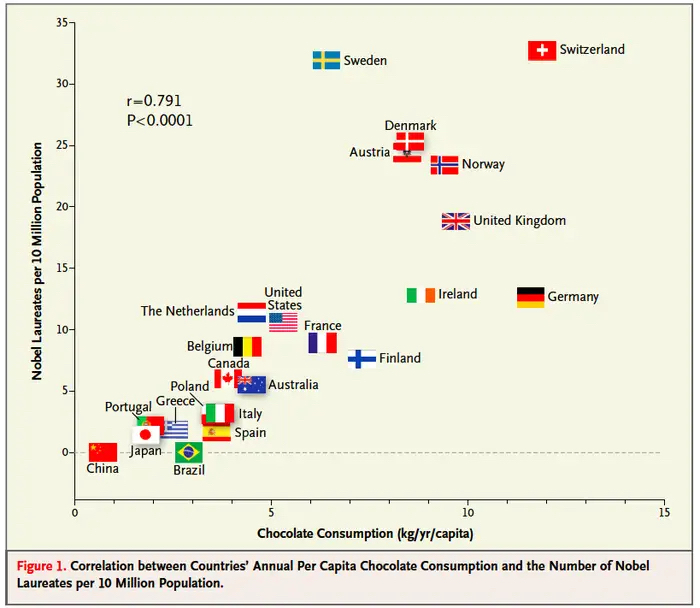
The two variables studied are chocolate consumption and level of intelligence. The first is measured in kg per person per year (the country’s chocolate consumption divided by the number of inhabitants) and the second by the number of Nobel Prize winners (per ten million inhabitants).
The higher the consumption of chocolate in the country, the higher the number of Nobel Prizes per 10 million inhabitants. To illustrate this:
- In Switzerland, with a chocolate consumption of a little less than 12 kg per person per year, the country has obtained more than 30 Nobel Prizes (per 10 million inhabitants).
- In France, with a chocolate consumption of just over 6 kg per person per year, the country has obtained less than 10 Nobel Prizes (per 10 million inhabitants).
The more chocolate we eat, the smarter we are. In other words, chocolate makes people intelligent.
There is a third variable which is the explanatory variable, the wealth of the country. The richer a country, the more its population can eat chocolate. At the same time, the richer a country, the more it can develop research. It is therefore wealth that explains the high consumption of chocolate and the strong involvement in research (hence the Nobel Prize winners).
Activité 2
These charts demonstrate the existence (or lack of existence) of correlation between two variables X and Y.
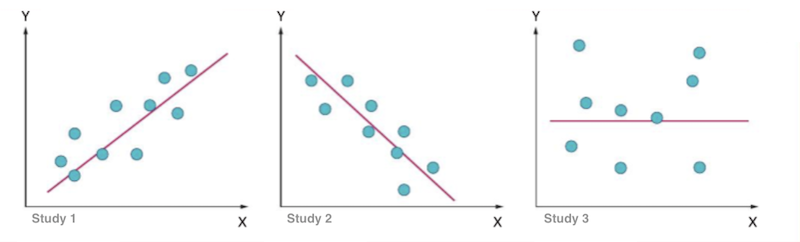
Three cases are possible, corresponding respectively to:
- a positive correlation (study 1: X and Y vary in the same way) ;
- a negative correlation (study 2, when X increases, Y decreases);
- an absence of correlation (study 3, there is no connection between X and Y).
2. Say, in your opinion, for each pair of variables below, whether or not there is correlation and, if the variables are related, what is the nature of the correlation (positive or negative): (sheet Positive and Negative Correlations)
Positive correlation.
Absence of correlation.
Absence of correlation.
Negative correlation.
Positive correlation.
Positive correlation.
Absence of correlation.
Absence of correlation.
Activité 3
Read the text; The need to seek causes
It is an incomplete causal explanation because it links the two phenomenon (rent freezing and the reduction of the number of housing for rent) without explaining why.
House owners may judge, that because of rent freezing, renting their dwelling would not be profitable given the maintenance costs: “Housing owners feel that the costs of maintaining their housing may exceed the benefits they expect to draw from rent« (doc The need to seek causes). As a result, some owners stop renting and therefore the number of housing for rent decreases.
3. Make a diagram that illustrates this causal relationship.
Evaluation
Answer questions about this lesson.
How do economists, sociologists and political scientists reason and work? – Séance 2
Quiz Summary
0 of 15 questions completed
Questions:
- 1
- 2
- 3
- 4
- 5
- 6
- 7
- 8
- 9
- 10
- 11
- 12
- 13
- 14
- 15
Information
You have already completed the quiz before. Hence you can not start it again.
Quiz is loading...
You must sign in or sign up to start the quiz.
Vous devez d’abord complété le suivant :
Résultats
Résultats
0 of 15 questions answered correctly
Your time:
Temps écoulé
You have reached 0 of 0 point(s), (0)
Earned Point(s): 0 of 0, (0)
0 Essay(s) Pending (Possible Point(s): 0)
| Score moyen |
|
| Votre score |
|
Catégories
- Pas classé 0%
- 1
- 2
- 3
- 4
- 5
- 6
- 7
- 8
- 9
- 10
- 11
- 12
- 13
- 14
- 15
- Répondu
- Révision
-
Question 1 of 15
1. Question
Hat size, number of children.
ExactInexact -
Question 2 of 15
2. Question
Weight, number of hospital visits per year.
ExactInexact -
Question 3 of 15
3. Question
Number of school absences, school grade
ExactInexact -
Question 4 of 15
4. Question
Adult’s age, number of hairs on their head
ExactInexact -
Question 5 of 15
5. Question
A person’s height, a person’s weight
ExactInexact -
Question 6 of 15
6. Question
Expenditure on clothing per year, shoe size.
ExactInexact -
Question 7 of 15
7. Question
Speed of a fighter plane, its G-force level
ExactInexact -
Question 8 of 15
8. Question
Average daily temperature, cost of central heating
ExactInexact -
Question 9 of 15
9. Question
Fuel efficiency of a car, expenditure on petrol per year.
ExactInexact -
Question 10 of 15
10. Question
Height of building, number of windows
ExactInexact -
Question 11 of 15
11. Question
What do we call people that win Nobel Prize’s?
ExactInexact -
Question 12 of 15
12. Question
A synonym of “housing”
ExactInexact -
Question 13 of 15
13. Question
What is rent freezing?
ExactInexact -
Question 14 of 15
14. Question
A synonym of “receive”.
ExactInexact -
Question 15 of 15
15. Question
Does chocolate make you intelligent?
ExactInexact